Figure S9« Back to Supplementary Information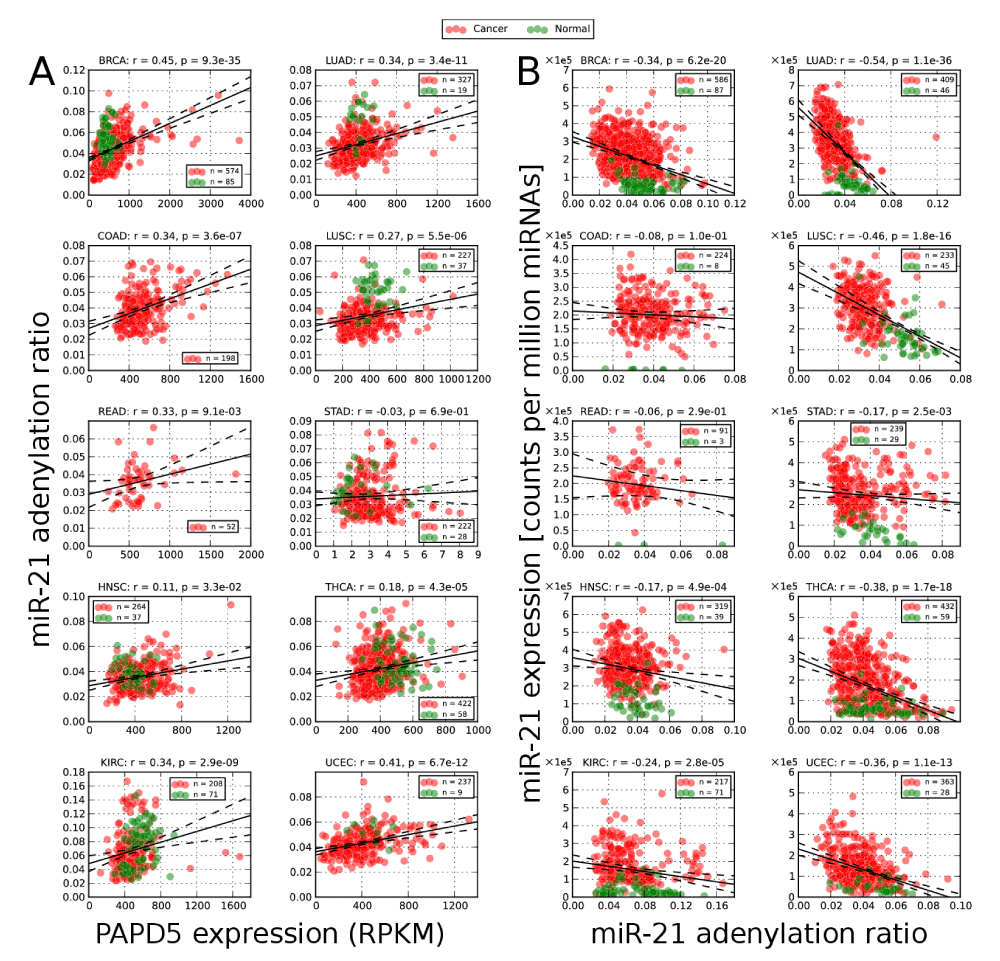
Figure S9: Correlations between PAPD5 expression, miR-21 expression, and miR-21 adenylation in 10 cancer types from TCGA [S1]. (A) In all cancer types except stomach adenocarcinoma (STAD), a statistically significant positive correlation was found between PAPD5 expression levels and miR-21 adenylation ratio. (B) In all cancer types except colon adenocarcinoma (COAD) and rectum adenocarcinoma (READ), a statistically significant negative correlation was found between miR-21 adenylation ratio and miR-21 expression level. The Spearman rank correlations and their corresponding significance values are shown. Dashed lines indicate the 95% confidence region of the regression line. S1. The Cancer Genome Atlas. Available at http://cancergenome.nih.gov/. Accessed August 29, 2013. |
|
|