Figure S8
« Back to Supplementary Information
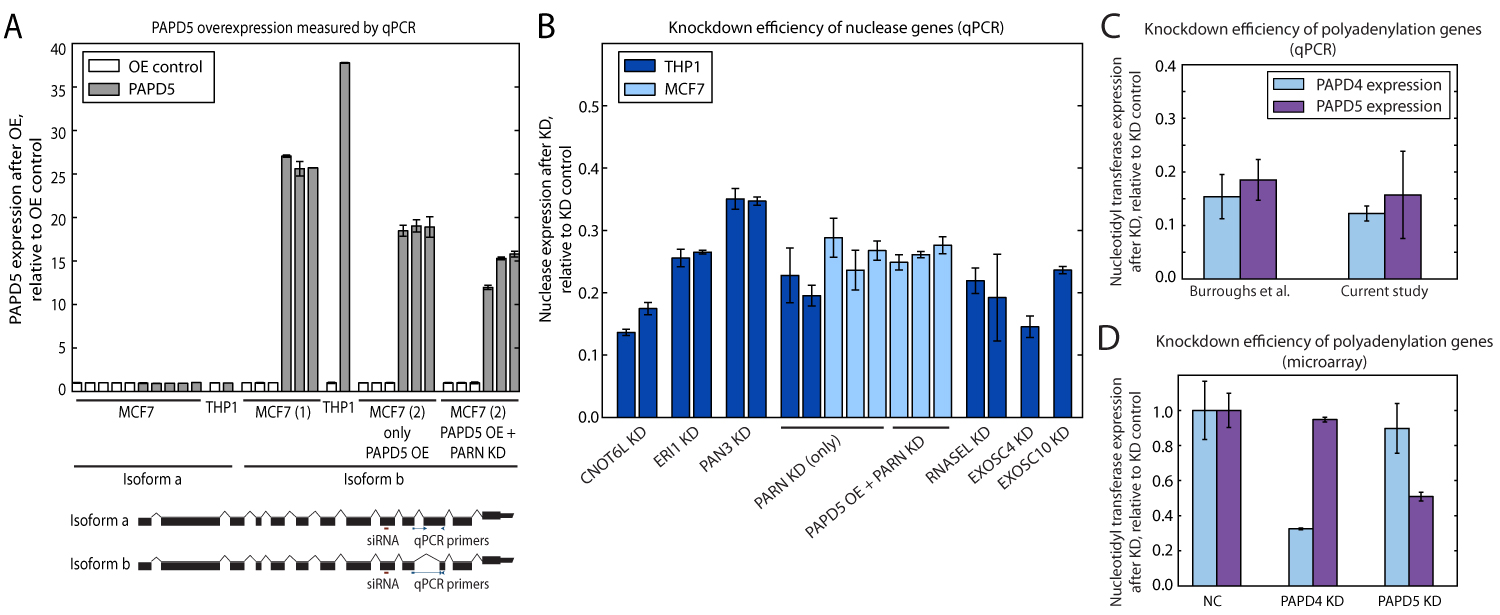
Figure S8: qPCR validation of knockdown and overexpression experiments. (A) Validation of PAPD5 overexpression in MCF7 and THP1. In both MCF7 and THP1 cells, PAPD5 was overexpressed by at least 10-fold compared to mock transfected cells. Our qPCR results confirm that only the transfected "b" isoform of PAPD5 is overexpressed, whereas the expression of the "a" isoform is unchanged. A comparison between the exon structure of the two PAPD5 mRNAs is shown in B, along with the primers used to amplify each respective isoform and the siRNA used for the knockdown experiments. For visualization purposes, 3' UTRs are truncated in the figure; primers spanning an exon-exon boundary are represented by thinner lines where they cross an intron. The Refseq (
http://www.ncbi.nlm.nih.gov/refseq/) accession for isoform a is NM_001040284 and NM_001040285 for isoform b. (B) qPCR validation of knockdown of candidate nucleases. Expression of the mRNAs of the nucleases CNOT6L, ERI1, PAN3, PARN, RNASEL, EXOSC4, and EXOSC10, as measured by qRT-PCR, confirmed that their knockdown was successful. Similarly, the knockdown of PARN in mock-transfected MCF7 cells and in MCF7 cells upon PAPD5 overexpression was confirmed by qPCR. In each case, the expression level of the exoribonuclease is shown relative to the corresponding NC condition. (C and D) Validation of PAPD4 and PAPD5 knockdown before mRNA expression profiling by microarray. Expression profiling was performed for two biological replicates each for the NC, the PAPD4 knockdown condition, and the PAPD5 knockdown condition. The expression of the PAPD4 and PAPD5 mRNAs, as measured by qRT-PCR (C) and microarray (D), indicated successful knockdown of these nucleotidyl transferases. In all panels, the error bars show the SD in the measured expression value.