Figure S3
« Back to Supplementary Information
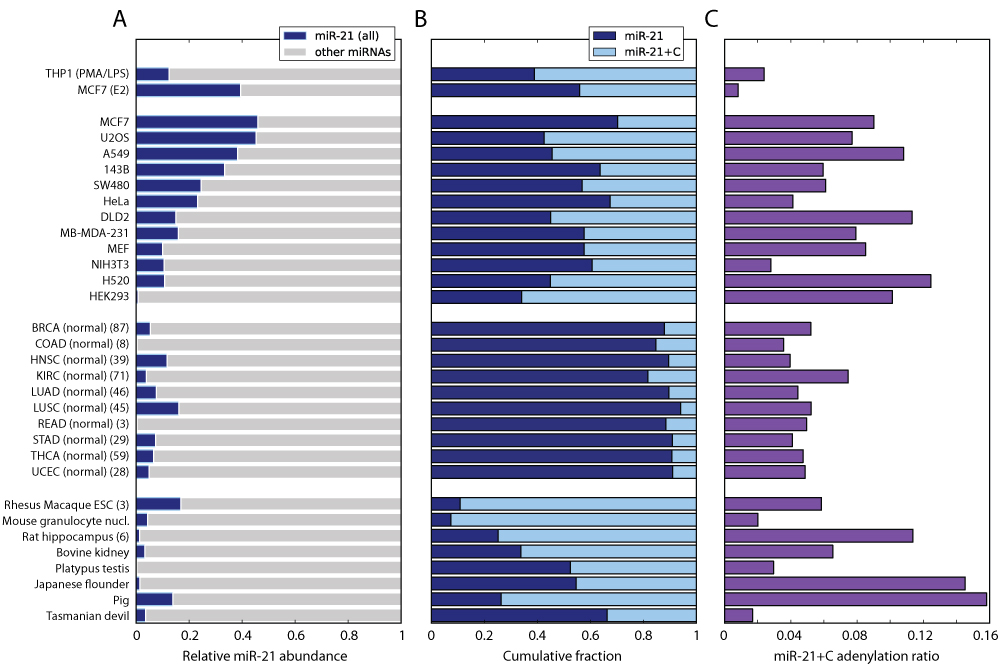
Figure S3: Expression of miR-21 and its isomiRs across samples and organisms.
MiR-21 abundance in various cell types (A) ranges from less than 0.1% for normal rectum cells (READ) to 39% for MCF7 cells. The degradation ratio (B) and adenylation ratios (C) (as defined in Figure 1) also vary greatly across cell types; THP1, MCF7, U2OS, A549, 143B, SW480, HeLa, DLD2, MB-MDA-231, and H520 being cancer cell lines; MEF, HEK293 and "Rhesus macaque ESC" are embryonic cells; BRCA, COAD, HNSC, KIRC, LUAD, LUSC, READ, STAD, THCA, and UCEC are normal (non-cancerous) primary tissue samples, and the other samples are healthy cells. The data set labeled "MCF7 (E2)" was sequenced after stimulation of MCF7 with 17β-estradiol, while the data set labeled "MCF7" is of an unperturbed MCF7 sample. See SI Materials and Methods for a detailed list of the data sets used in this study and Figure S1 for a list of abbreviations and definitions.