Figure S2« Back to Supplementary Information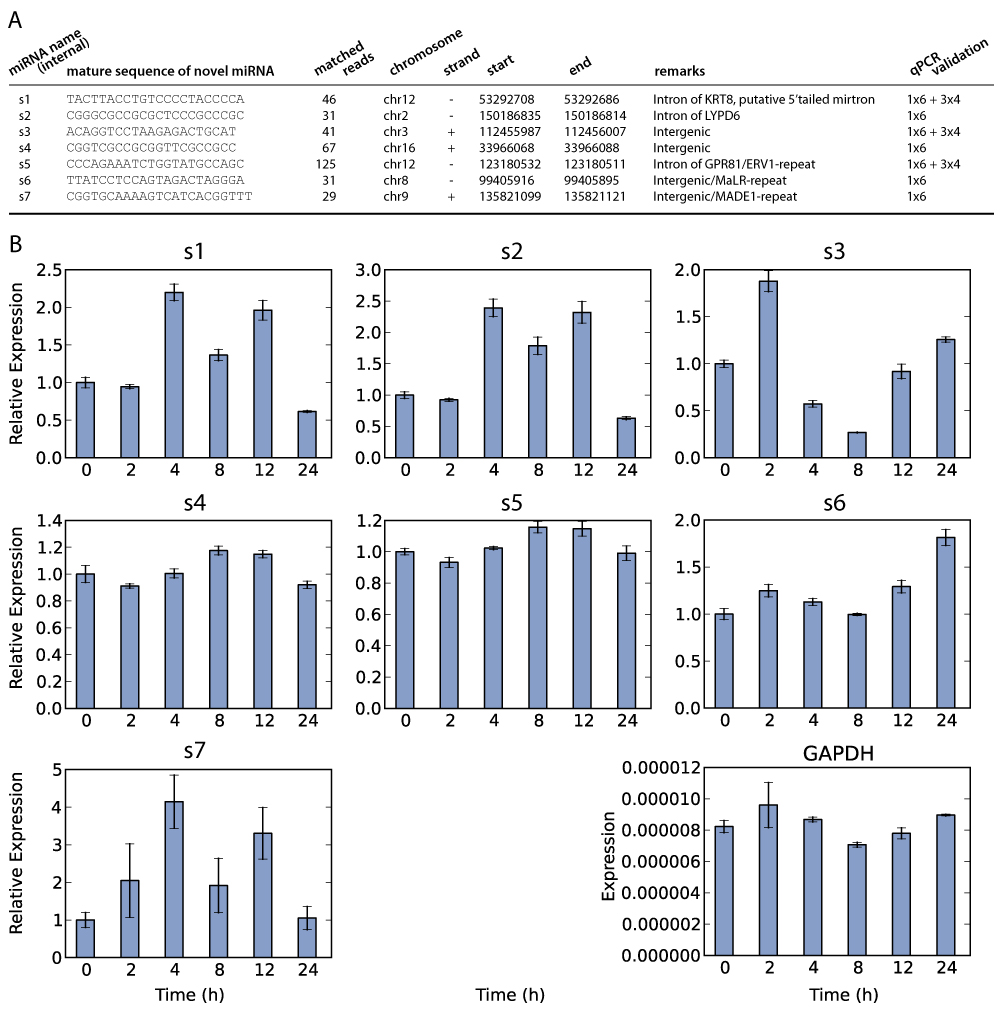
Figure S2: Prediction of miRNAs in MCF7 and their validation by qPCR. (A) Deep-sequencing data of estrogen-stimulated MCF7 cells were aligned to known genomic and transcriptomic features. Subsequent analysis of the remaining reads with miRDeep lead to the discovery of 7 previously unidentified miRNAs (see SI Materials and Methods for details). For each of these miRNAs, its sequence and coordinates on the hg19 genome assembly are shown. In addition, information about its genomic surroundings is displayed, such as its host gene. All miRNAs in A were confirmed using qPCR. (B) For each miRNA shown in A, qRT-PCR experiments were performed in triplicate from the same pool of RNA, both at t = 0 and at five time points after stimulation with 100 nM E2. GAPDH mRNA was used for normalization, as described in [S1], and is shown in bottom right. Displayed values for these miRNAs are relative to those at t = 0. Error bars represent the SD in the measured expression value. S1. Lagonigro MS, et al. (2004) CTAB-urea method purifies RNA from melanin for cDNA microarray analysis. Pigment Cell Res 17(3):312-315. |
|
|